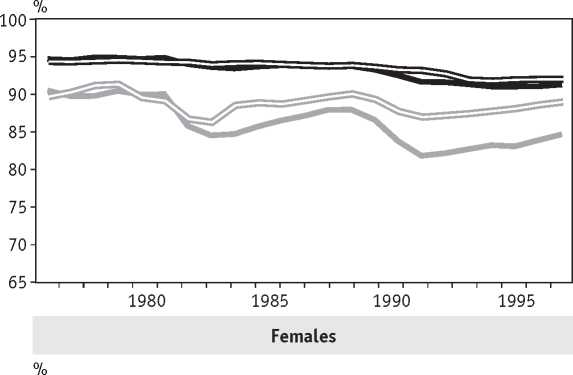
Chart 7 Participation and employment rates 25-54
Males
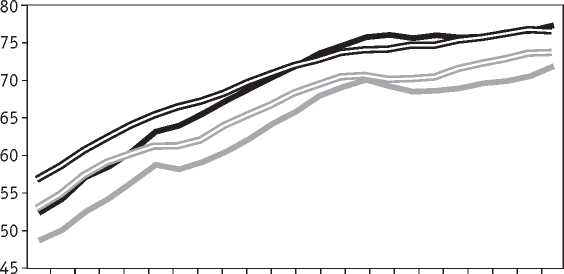
1980 1985 1990 1995
Canadian participation rate Canadian employment rate
U.S. participation rate U.S. employment rate
they rose in the 1980s in both countries, even as
employment rates increased, perhaps responding
to factors such as the continuing shift in demand
from low- to higher-skilled jobs.
The premium paid to workers with higher lev-
els of education is one incentive to spend more
years in school. Since, in Canada, there is little
evidence these premiums have increased since
the 1970s, they do not account for the rising trend
in attendance rates (Bar-Or et. al., 1995, Beaudry
and Green, 1997). The failure for these premiums
to rise may be because the supply of educated
youth has been growing faster than the demand
for such workers. Nevertheless, the lower unem-
ployment rate for those with higher levels of edu-
cation13 may be a sufficiently strong incentive for
relatively more young people to choose to stay in
school and thus improve their employment pros-
pects.14
Interpreting the differences between Canadian
and U.S. school attendance rate increases from
1989 to 1997 as the cyclical component of the Ca-
nadian increase implies that for teens the struc-
tural increase in the attendance rate accounted for
about 1.75 percentage points, or 15 per cent, of
the 12 percentage point fall in their participation
rate. For young adults the structural component
would account for 3.4 percentage points, or 60 per
cent, of the drop of 5.7 percentage points in their
participation rate. These two effects combined ap-
pear to account for about 0.4 percentage points of
the decline in the aggregate participation rate.15
Possible Structural
Influences on
Participation Rates of
Major Age/Gender
Groups
The disaggregrated data for the three age
groups considered here show that the similarity
before 1990 between the aggregate Canadian and
U.S. participation rate levels and trends extended
to most sub-groups. Even beyond 1990 there were
remarkable similarities in some groups though
the aggregate rates were so different.
The core labour force: ages 25-54
For the core labour force group as a whole
(aged 25-54), the steeply rising trend in the female
participation rates in the 1970s and 1980s out-
weighed the declining trend in the rates for men.
In the 1990s, however, the rate for women flat-
tened out in Canada and slowed considerably in
the United States, while the decline in the rate for
men picked up (Chart 7). Because this group has
a strong attachment to the labour force, its partici-
pation rate is relatively insensitive to changes in
the business cycle.
Since the 1981-82 recession, Canadians have
stayed in the labour force almost to the same de-
gree that Americans have — both men and
women — while employment rates have gener-
ally been much lower in Canada. This indicates
that Canadian adults have a stronger attachment
to the labour force. The similarity in participation
rates in the 1990s is particularly remarkable, tak-
Canadian Business Economics
Summer 1999
More intriguing information
1. Critical Race Theory and Education: Racism and antiracism in educational theory and praxis David Gillborn*2. The name is absent
3. The Challenge of Urban Regeneration in Deprived European Neighbourhoods - a Partnership Approach
4. INTERACTION EFFECTS OF PROMOTION, RESEARCH, AND PRICE SUPPORT PROGRAMS FOR U.S. COTTON
5. The name is absent
6. On the estimation of hospital cost: the approach
7. Tariff Escalation and Invasive Species Risk
8. The name is absent
9. Income Taxation when Markets are Incomplete
10. The name is absent