Figure 1. Volatility and Openness in the 1990s
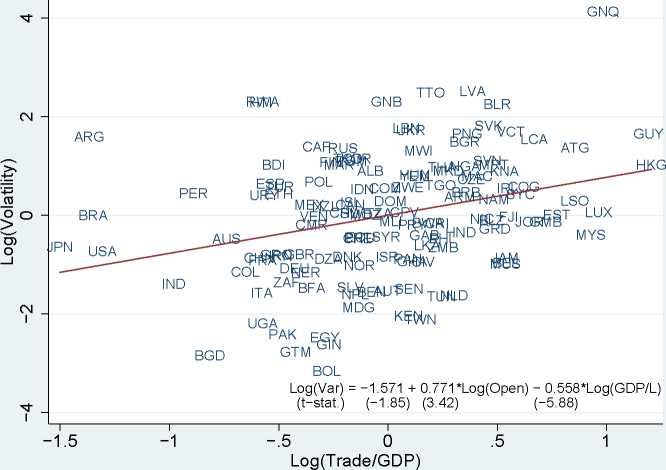
Notes: Source: Penn World Tables. Volatility is calculated using annual growth rates over 1990-99 for per-capita
GDP, and trade openness is the average of imports plus exports divided by GDP over the same period.
Figure 2. Comparison of Manufacturing and Aggregate Volatility
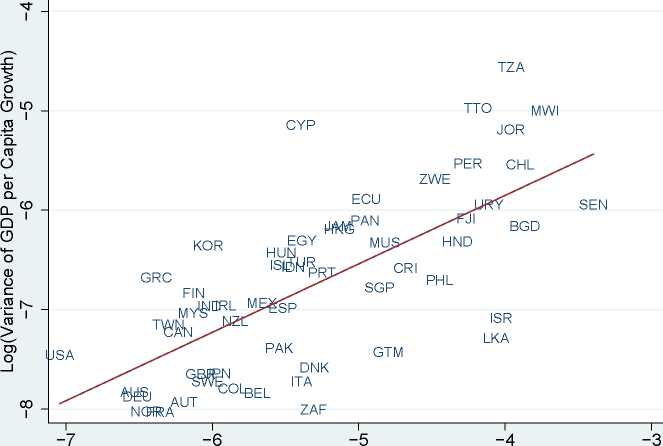
Log(Variance of Manufacturing Output per Worker Growth)
Notes: Volatility is calculated using annual growth rates over 1970-99 for manufacturing output per worker and
per-capita GDP from the Penn World Tables, respectively.
32
More intriguing information
1. Synthesis and biological activity of α-galactosyl ceramide KRN7000 and galactosyl (α1→2) galactosyl ceramide2. sycnoιogιcaι spaces
3. On the Real Exchange Rate Effects of Higher Electricity Prices in South Africa
4. Special and Differential Treatment in the WTO Agricultural Negotiations
5. The name is absent
6. Fighting windmills? EU industrial interests and global climate negotiations
7. The geography of collaborative knowledge production: entropy techniques and results for the European Union
8. Prevalence of exclusive breastfeeding and its determinants in first 6 months of life: A prospective study
9. The urban sprawl dynamics: does a neural network understand the spatial logic better than a cellular automata?
10. The name is absent