Figure 3. Manufacturing Output Volatility and Openness
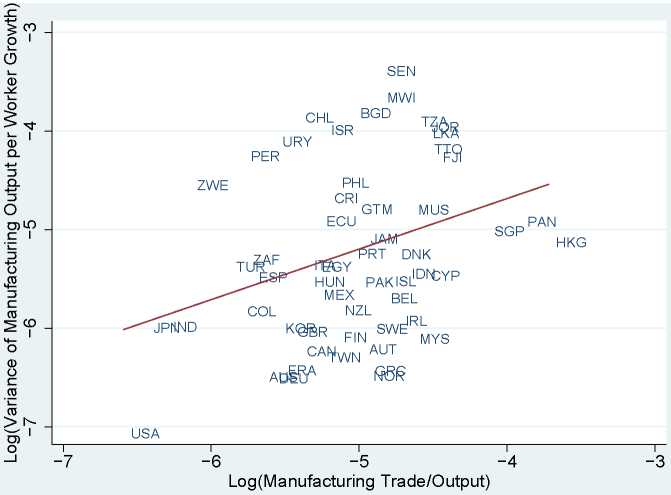
Notes: Manufacturing output volatility is calculated using annual growth rates over 1970-99, and the manufacturing
trade-to-output ratio is an average over 1970-99.

Figure 4. Trade and Specialization
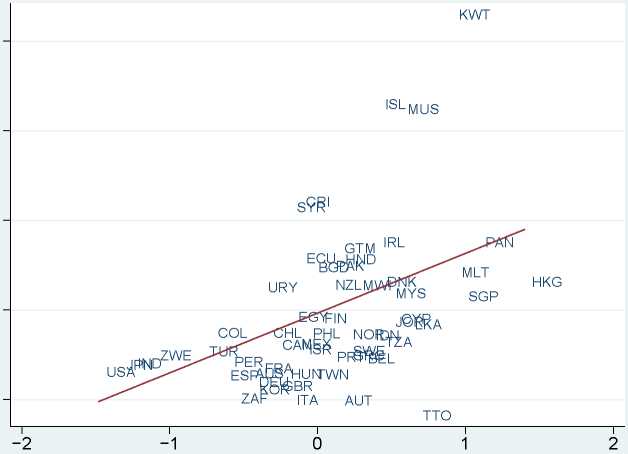
Log(Trade∕GDP)
Notes: The Herfindahl of production shares and the manufacturing trade-to-output measures ratio are averages for
1970-99. The graph reports partial correlations with GDP per capita netted out.
33
More intriguing information
1. 5th and 8th grade pupils’ and teachers’ perceptions of the relationships between teaching methods, classroom ethos, and positive affective attitudes towards learning mathematics in Japan2. A methodological approach in order to support decision-makers when defining Mobility and Transportation Politics
3. The effect of classroom diversity on tolerance and participation in England, Sweden and Germany
4. ENERGY-RELATED INPUT DEMAND BY CROP PRODUCERS
5. Problems of operationalizing the concept of a cost-of-living index
6. A Study of Prospective Ophthalmology Residents’ Career Perceptions
7. The name is absent
8. The name is absent
9. Artificial neural networks as models of stimulus control*
10. The name is absent