CHAPTER 5. SIMULATION RESULTS
37
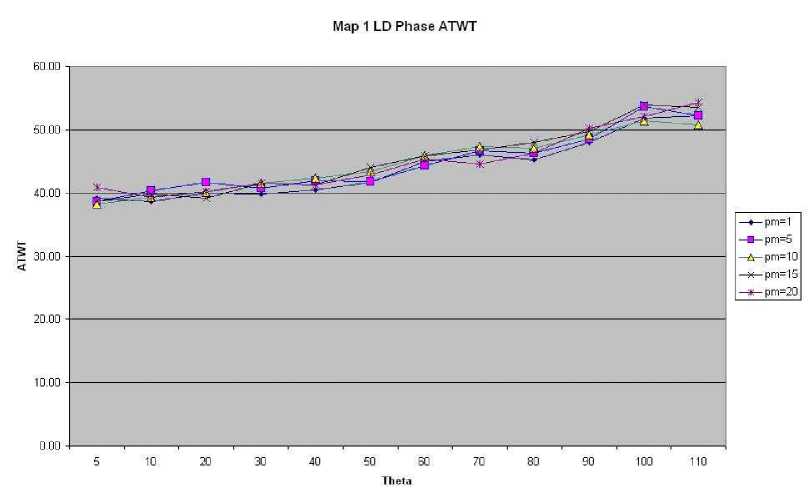
Figure 5.9: Map1- low density - Phase control - ATWT
Low traffic density Figure 5.9 shows that all values of θ give almost the same
result in ATWT. At low traffic density, the θ has almost no influence on the ATWT
value. The queues are emtpy for all values of θ. The best ATWT is found for
θ = 5 and φmin = 10, which gives a value of 38.21. The results for θ = 10 and
φmin = 1, and θ = 5 and φmin = 5 are also good.
More intriguing information
1. EMU's Decentralized System of Fiscal Policy2. QUEST II. A Multi-Country Business Cycle and Growth Model
3. Anti Microbial Resistance Profile of E. coli isolates From Tropical Free Range Chickens
4. The name is absent
5. The name is absent
6. HEDONIC PRICES IN THE MALTING BARLEY MARKET
7. Ronald Patterson, Violinist; Brooks Smith, Pianist
8. Top-Down Mass Analysis of Protein Tyrosine Nitration: Comparison of Electron Capture Dissociation with “Slow-Heating” Tandem Mass Spectrometry Methods
9. Towards a framework for critical citizenship education
10. On Social and Market Sanctions in Deterring non Compliance in Pollution Standards