CHAPTER 5. SIMULATION RESULTS
35
High traffic density The sotl-request controller has the lowest ATWT value
(343.94) for θ = 110. For this θ it has also the lowest TWQL (1457). Figure 5.6
on the previous page gives the lowest ATWT values for very low θ or big values
of θ. For θ = 5, the traffic lights are switching very fast because the threshold is
reached immediately. It is more useful to take a bigger θ because the green times
will be longer and the best results are found. The length of the waiting queues is
the lowest (1457) for θ = 110 and the highest (1864) for θ = 50.
Map 1 LD RequestATWT
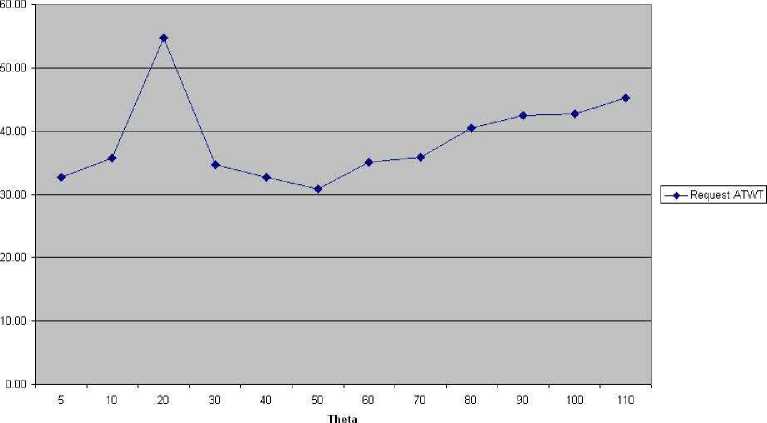
Figure 5.7: Map1- low density - Request control - ATWT
Low traffic density The best ATWT for the request controller at low traffic
density is given for θ = 50. This gives a value (ATWT) of 30.92 and no waiting
road users in the queues. The highest value is given for θ = 20 with an ATWT of
54.72. (see figure 5.7)
More intriguing information
1. Influence of Mucilage Viscosity On The Globule Structure And Stability Of Certain Starch Emulsions2. The name is absent
3. Knowledge, Innovation and Agglomeration - regionalized multiple indicators and evidence from Brazil
4. Target Acquisition in Multiscale Electronic Worlds
5. Plasmid-Encoded Multidrug Resistance of Salmonella typhi and some Enteric Bacteria in and around Kolkata, India: A Preliminary Study
6. The name is absent
7. Optimal Tax Policy when Firms are Internationally Mobile
8. Activation of s28-dependent transcription in Escherichia coli by the cyclic AMP receptor protein requires an unusual promoter organization
9. Gender and headship in the twenty-first century
10. The name is absent