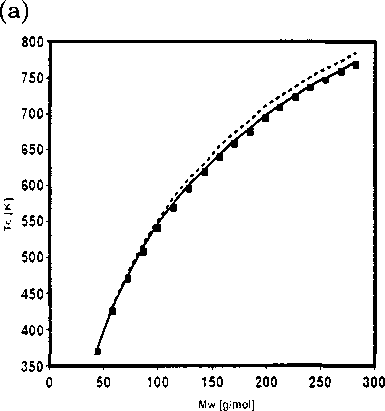
Figure 2.5: (a) Comparison of the critical temperatures from the new equation of state
(solid line) and PC-SAFT (dashed line) with experimental data for n-alkane series from
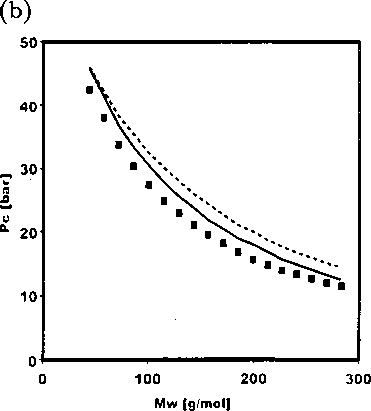
n-C3 to n-C20 (b) Comparison of the critical pressures from the new equation of state
(solid line) and PC-SAFT (dashed line) with experimental data for n-alkane series from
n-C3 to n-C20.
properties of n-alkanes accurately, the tests for the robustness of the parameters are
that they must follow a definite trend and when extrapolated to higher molecular
weights, should predict the thermodynamics with reasonable accuracy.
Figure 2.6 shows the trend of the parameters with increasing molar mass. The
parameters show a smooth course and tend to approach a constant value at large
molecular weights. The pure component parameters can be correlated to the molec-
ular weight using the following functional form,
parameter{k) = qok +
M — Mc3H8 , Mi — Mc3h8 Mi — 2Mc3h8
(2.31)
Mi qik + Mi Mi q2‘
51
More intriguing information
1. Cross border cooperation –promoter of tourism development2. The name is absent
3. Restricted Export Flexibility and Risk Management with Options and Futures
4. The name is absent
5. Developmental Robots - A New Paradigm
6. The name is absent
7. Tissue Tracking Imaging for Identifying the Origin of Idiopathic Ventricular Arrhythmias: A New Role of Cardiac Ultrasound in Electrophysiology
8. The name is absent
9. The name is absent
10. Financial Market Volatility and Primary Placements