Chapter 5
I !Water in middle oil layer
BB Water at bottom oil layer
^BSolid in oil layer
_WateL
CiriteirSa
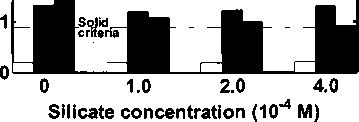
Silicate concentration (10^4 M)
Adding 200 ppm PR5
I !Water in middle oil layer
^B Water at bottom oil layer
^BSolid in oil layer
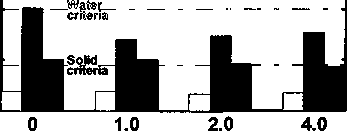
Silicate concentration (1(Γ4 M)
Silicate concentration (10^4 M)
Adding 200 ppm PR6
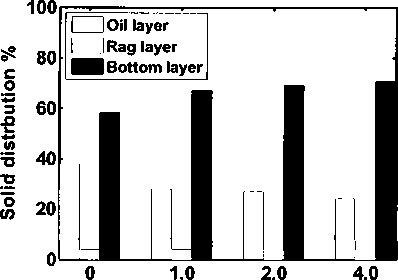
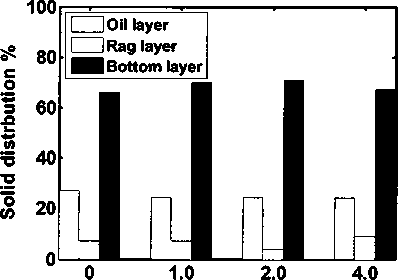
Figure 5.20 Water and solid content in oil layer and solid distribution in different
layers adding 200 ppm PR5 and PR6 with different amount of silicate, N∕B 4.0
Fig. 5.21 shows bar diagrams of residual water/ solid content in oil layer and
solid distribution in different layers of 24 hours emulsion (dilution ratio 0.7) using
200 ppm demulsifiers PR6 to PR6 with and without Na6SiO3. The red and black
dashed lines show the desired residual water and solid content in oil (2.0% and
0.9%, respectively).
182
More intriguing information
1. Handling the measurement error problem by means of panel data: Moment methods applied on firm data2. Automatic Dream Sentiment Analysis
3. Citizenship
4. Shifting Identities and Blurring Boundaries: The Emergence of Third Space Professionals in UK Higher Education
5. Plasmid-Encoded Multidrug Resistance of Salmonella typhi and some Enteric Bacteria in and around Kolkata, India: A Preliminary Study
6. Inhimillinen pääoma ja palkat Suomessa: Paluu perusmalliin
7. The name is absent
8. Valuing Farm Financial Information
9. Nurses' retention and hospital characteristics in New South Wales, CHERE Discussion Paper No 52
10. Nonlinear Production, Abatement, Pollution and Materials Balance Reconsidered