Chapter 5
Demulsifier
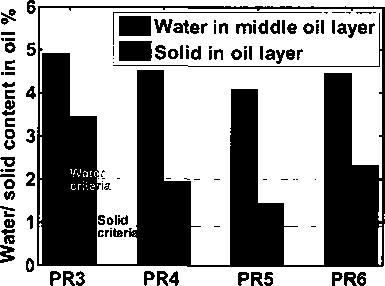
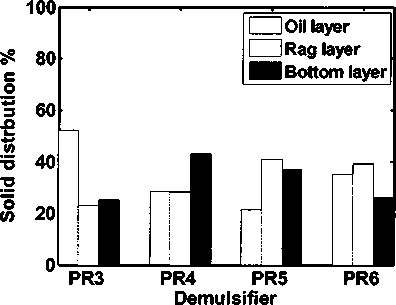
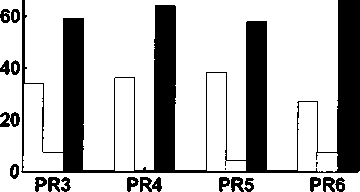
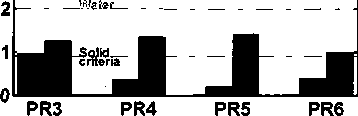
Figure 5.18 shows bar diagrams of residual water/ solid content in oil layer
and solid distribution in different layers using 200 ppm demulsifiers PR3 to PRe-
The red and black dashed lines show the desired residual water and solid content
in oil (2.0% and 0.9%, respectively). For the sample with N/В ratio adding 200
ppm PR4, rag layer is too thin that solid fraction in rag layer is considered as zero.
Dilution ratio 0.7
Water in middle oil layer
Water at bottom oil layer
100∣—.--------.---- ■ —
Oil layer
80 r≡9 layer
И Bottom layer
Demulsifier
Demulsifier
Dilution ratio 4.0
Figure 5.18 Water and solid content in oil layer and solid distribution in different
layers adding 200 ppm demulsifiers PR3 to PR6
179
More intriguing information
1. The name is absent2. An Interview with Thomas J. Sargent
3. The name is absent
4. Experimental Evidence of Risk Aversion in Consumer Markets: The Case of Beef Tenderness
5. Les freins culturels à l'adoption des IFRS en Europe : une analyse du cas français
6. Synthesis and biological activity of α-galactosyl ceramide KRN7000 and galactosyl (α1→2) galactosyl ceramide
7. From Communication to Presence: Cognition, Emotions and Culture towards the Ultimate Communicative Experience. Festschrift in honor of Luigi Anolli
8. Insurance within the firm
9. The name is absent
10. International Financial Integration*