Chapter 3
four emulsion samples described in Table 3.2. The waiting time tw is 0.6 s. The
imaging pulse field gradient is 0.8 G∕cm. In Figure 3.16, x axis A is signal
amplitude of the sample, y axis position is the position measured from the middle
of the sample. It ranges from -2 cm to 2 cm; the total length is about 4 cm, which is
equal to the height of the sample.
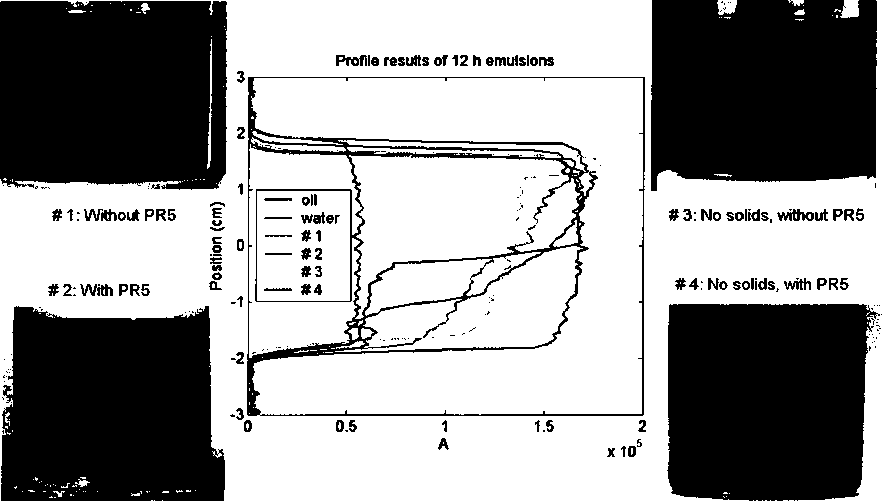
Figure 3.16 NMR 1-D 7^ι weighted profile measurement Ofemulsion samples 1- 4
The Ti value of water is greater than diluted bitumen, so the attenuation of
water is smaller than diluted bitumen based on the Eq. [3.33]. Thereby in the
profile results, the signal amplitude of water is smaller than that of oil. Based on
the 7^ι difference, the signal amplitudes of different phases in the emulsion
become distinguishable.
70
More intriguing information
1. Synthesis and biological activity of α-galactosyl ceramide KRN7000 and galactosyl (α1→2) galactosyl ceramide2. The name is absent
3. The name is absent
4. El Mercosur y la integración económica global
5. Sector Switching: An Unexplored Dimension of Firm Dynamics in Developing Countries
6. APPLICATIONS OF DUALITY THEORY TO AGRICULTURE
7. Ex post analysis of the regional impacts of major infrastructure: the Channel Tunnel 10 years on.
8. The name is absent
9. Momentum in Australian Stock Returns: An Update
10. The name is absent