3.1.2 Global flow of the power tomography
-norm min.
with SpatUI
constrains (TUSC)
aπatιon
shmatιon>
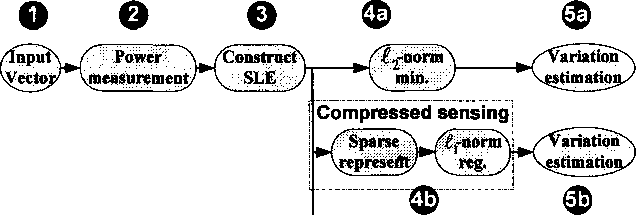
Figure 3.1: Global flow of the power tomography.
Figure 3.1 shows the global flow of our method. A number of random input
vectors are applied to the circuit, and the leakage current corresponding to each
input vector is measured (Steps 1 and 2). Next, a system of linear equations is
formed where each equation corresponds to one measurement (Step 3). The equa-
tion unknowns are the (normalized) leakage current variations of each gates. The
standard way to estimate the IC’s leakage tomogram is to use Z⅛-norm optimiza-
tion (Steps 4a-5a). However, our method exploits spatial correlations of the sta-
tistical leakage variations and compressive sensing theory to estimate efficiently
the leakage tomogram (Steps 4b-5b). We also enforce the spatial constraint on
power variations estimation directly (the TUSC method in Steps 4c-5c).
25
More intriguing information
1. ROBUST CLASSIFICATION WITH CONTEXT-SENSITIVE FEATURES2. The name is absent
3. Optimal Tax Policy when Firms are Internationally Mobile
4. ADJUSTMENT TO GLOBALISATION: A STUDY OF THE FOOTWEAR INDUSTRY IN EUROPE
5. Factores de alteração da composição da Despesa Pública: o caso norte-americano
6. Skill and work experience in the European knowledge economy
7. The name is absent
8. The name is absent
9. The name is absent
10. Importing Feminist Criticism