10 20 30 40 50 60
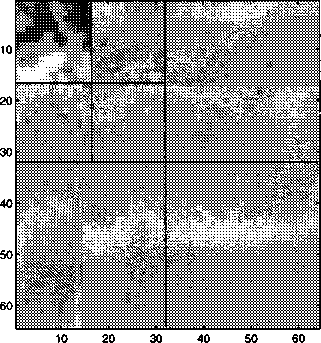
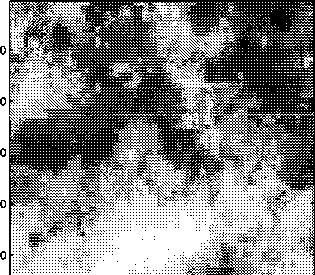
Figure 4.3: Left: Spatial correlation in delay variations in a typical IC. Right: wavelet
transform of the variation. Because of the spatial correlation the variation
is sparse in the wavelet domain.
the model significantly improve the results and allows resolving the ambiguities
described in the previous section. This section incorporates sparsity in the wavelet
domain as a model for the spatial correlation of the timing variation. Thus, we
can use compressive sensing theory to estimate the variations more accurately.
4.3.1 Sparse representation of variations
As we explained in Section 3.3.1, because of the spatial correlation, wavelet basis
can sparsely represent the variations. Similar to power tomography, we use the
wavelet basis to sparsely represent variations. Note that variations in power
framework are based on a log-normal distribution but variations in the delay are
approximately normally distributed. Thus, power variations and delay variations
47
More intriguing information
1. Graphical Data Representation in Bankruptcy Analysis2. The Variable-Rate Decision for Multiple Inputs with Multiple Management Zones
3. The growing importance of risk in financial regulation
4. Notes on an Endogenous Growth Model with two Capital Stocks II: The Stochastic Case
5. Eigentumsrechtliche Dezentralisierung und institutioneller Wettbewerb
6. BEN CHOI & YANBING CHEN
7. Climate Policy under Sustainable Discounted Utilitarianism
8. The Macroeconomic Determinants of Volatility in Precious Metals Markets
9. The name is absent
10. Micro-strategies of Contextualization Cross-national Transfer of Socially Responsible Investment