10‘
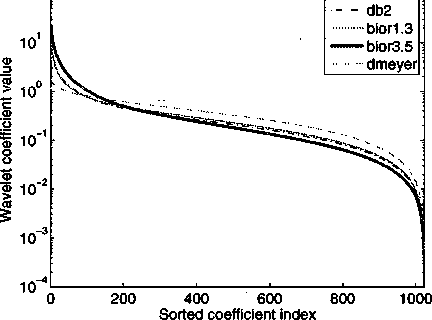
Figure 4.4: Sorted wavelet coefficients for different bases, bio3.5 bases results in the
most sparse representation.
might be sparse in different wavelet bases.
Figure 4.3 demonstrates the effectiveness of the wavelet transform in repre-
senting spatial variations. The left side of the figure is the image plot of the
variations in a typical IC, generated using the Gaussian model in [47]. The spa-
tial correlation is evident in the figure. The right side of the figure represents
the wavelet transform of the left hand side. Most of the transform coefficients
are zero. Only the top-left part of the figure has a dense amount of significant
non-zero elements.
Figure 4.4 presents the decay rate of the wavelet coefficients for a number
of different wavelet transforms. A transform appropriate for compressed sensing
should have a fast decay rate. The faster the decay, the sparser the signal under
this transform, and the fewer the measurements necessary to acquire the variation
48
More intriguing information
1. The name is absent2. The name is absent
3. The name is absent
4. The name is absent
5. The name is absent
6. A simple enquiry on heterogeneous lending rates and lending behaviour
7. Pupils’ attitudes towards art teaching in primary school: an evaluation tool
8. Modellgestützte Politikberatung im Naturschutz: Zur „optimalen“ Flächennutzung in der Agrarlandschaft des Biosphärenreservates „Mittlere Elbe“
9. Social Cohesion as a Real-life Phenomenon: Exploring the Validity of the Universalist and Particularist Perspectives
10. The name is absent