Graph 1: Frequency of reforms during years of consolidations and years where primary cyclically-adjusted
budget balances worsened (see table 1 for sample definition)
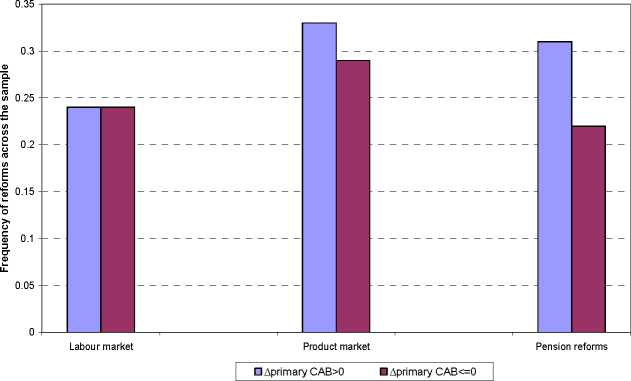
Source: Authors’ calculation on data described in table 1
Graph 2: Frequency of reforms before and after phase II of EMU (see table 1 for sample definition)
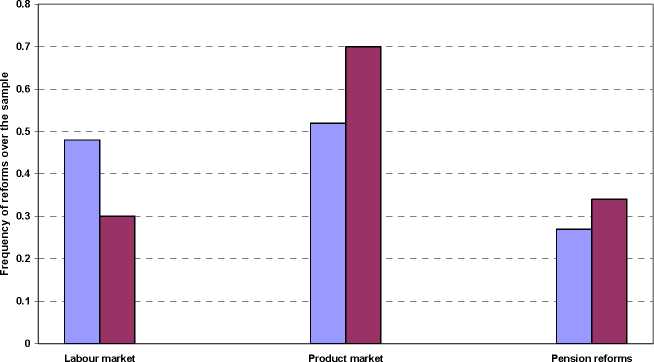
□ 1990-1993 □ after 1994
Source: Authors’ calculation on data described in table 1
121
More intriguing information
1. The name is absent2. Nonparametric cointegration analysis
3. Government spending composition, technical change and wage inequality
4. Climate Policy under Sustainable Discounted Utilitarianism
5. The name is absent
6. Mergers under endogenous minimum quality standard: a note
7. The name is absent
8. Nach der Einführung von Arbeitslosengeld II: deutlich mehr Verlierer als Gewinner unter den Hilfeempfängern
9. The East Asian banking sector—overweight?
10. Optimal Rent Extraction in Pre-Industrial England and France – Default Risk and Monitoring Costs