25
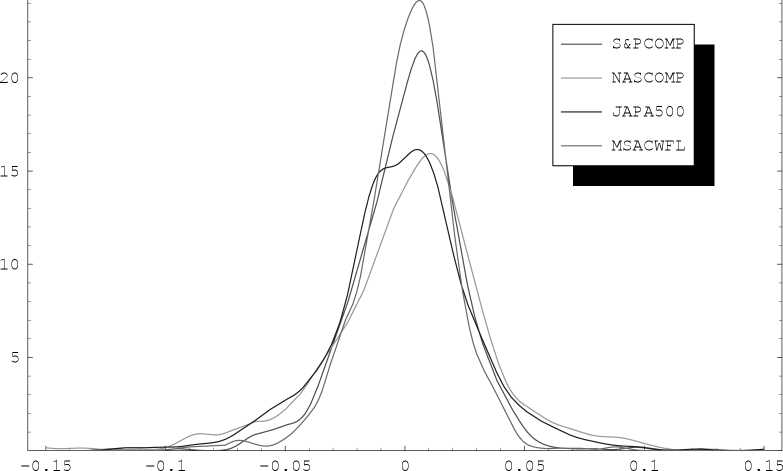
Figure 1: Kernel estimates of the distribution of weekly returns.
and
Table 3 presents the results of the maximum likelihood estimation of the parameters
of the marginals. In the table we present also the values of the averaged Ioglikelihood
function at maximum. Then, we have obtained the following maximum likelihood esti-
mates of the parameters ɑ in the three cases considered:
|
^0.0000 |
0.0702 0.0476 |
0.0000 0.0000 |
0.1072∖ 0.0357 | |
|
«SST = |
0.0491 |
0.0342 0.0000/ | ||
|
/0.0000 |
0.0730 |
0.0000 |
0.1095∖ | |
|
«SGSH = |
∖ |
0.0467 |
0.0000 0.0419 |
0.0363 0.0338 0.0000/ |
|
<0.0000 |
0.0728 |
0.0000 |
0.1086∖ | |
|
<*SEP = |
0.0473 |
0.0000 0.0385 |
0.0358 0.0332 0.0000/ |
with the values of the averaged Ioglikelihood function at maximum, respectively, equal
to 12.9449, 12.9496 and 12.94153.
Note that the three marginals have a similar behaviour, also if the shape parameter
of the skew Student-t for the NASCOMP index is lower than 4 and, as a consequence,
it has not kurtosis index. Also the structure of ɑ is very similar in the three cases
considered, confirming what we have writtem in the previous section.
3We have used a quasi-Newton algorithm to obtain the maximum of Ioglikelihood functions.
More intriguing information
1. Education and Development: The Issues and the Evidence2. The name is absent
3. Automatic Dream Sentiment Analysis
4. The name is absent
5. Experience, Innovation and Productivity - Empirical Evidence from Italy's Slowdown
6. NEW DEVELOPMENTS IN FARM PRICE AND INCOME POLICY PROGRAMS: PART I. SITUATION AND PROBLEM
7. Regional science policy and the growth of knowledge megacentres in bioscience clusters
8. 5th and 8th grade pupils’ and teachers’ perceptions of the relationships between teaching methods, classroom ethos, and positive affective attitudes towards learning mathematics in Japan
9. On the Real Exchange Rate Effects of Higher Electricity Prices in South Africa
10. QUEST II. A Multi-Country Business Cycle and Growth Model