28
Stata Technical Bulletin
STB-48
Cum. Dist. of eqinc_m/_N
Cum. Pop. Prop.
Cum. Dist. of mchpay/_N
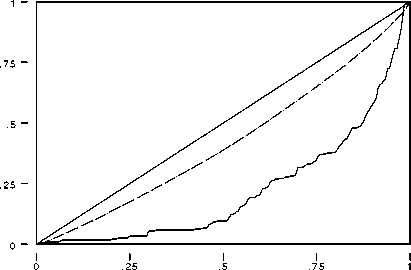
Population Share, p_i
Lorenz and Concentration Curves
Figure 3. Lorenz and concentration curves for child benefits.
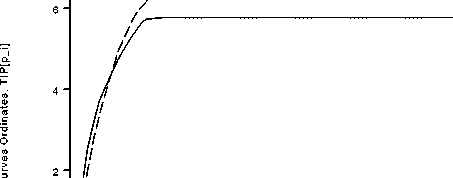
Let us finally show how TIP curves can be constructed. Suppose we wish to make poverty comparisons among two population
subgroups, households who own their house (solid lines below) and households who rent their house (dashed lines below). We
set the poverty line at 200 monetary units. To draw the TIP curves of absolute poverty gaps, simply type
. generate tip = (200 - eqinc)*(eqinc<=200)
. glcurve tip , gl(tip) p(tipp) sort(eqinc) by(owner) split
> xlabel(0,0.25,0.50,0.75,1) ylabel
tip[Tenant] ∙ tip[Owner]
I
I
0 .25 .5 .75 1
Population Share, p_i
Three I's of Poverty Curves
Figure 4. TIP curves of absolute poverty gaps for home owners and renters.
Imagine now that we consider setting a lower poverty line for households that own their houses, e.g., 170 monetary units.
We want to construct TIP curves of relative poverty gaps:
. generate tiprel = (1 - (eqinc/200))*(eqinc<=200) if owner==0
. replace tiprel = (1 - (eqinc∕170))*(eqinc<=170) if owner==l
. glcurve tiprel , gl(tipr) p(tipp) replace sort(eqinc) by(owner)
> split xlabel(0,0.25,0.50,0.75,1) ylabel
(Graph on next page)
More intriguing information
1. Synthesis and biological activity of α-galactosyl ceramide KRN7000 and galactosyl (α1→2) galactosyl ceramide2. The name is absent
3. Neural Network Modelling of Constrained Spatial Interaction Flows
4. Human Development and Regional Disparities in Iran:A Policy Model
5. Fighting windmills? EU industrial interests and global climate negotiations
6. The name is absent
7. The name is absent
8. A methodological approach in order to support decision-makers when defining Mobility and Transportation Politics
9. The name is absent
10. The WTO and the Cartagena Protocol: International Policy Coordination or Conflict?