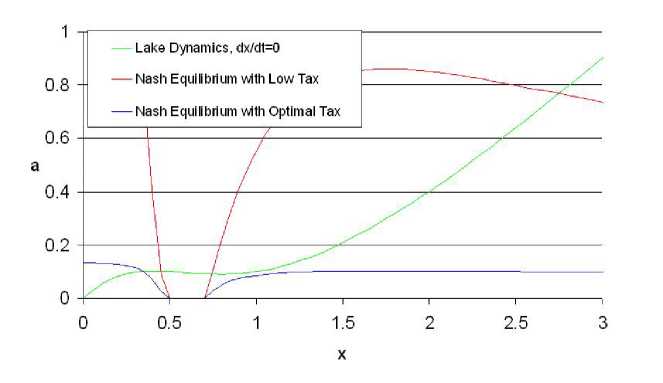
Figure 4: Nash Equilibrium Loading Low Tax and Optimal Tax
sired policy applied. The simplest, linear, form of the model is applied where
the expected payoff of each player is defined as the ratio of his investment di-
vided by the sum of the investments of all the players, multiplied by the reward
if he wins. Here, the investments are the lobbying efforts and the rewards are
the communities’ net benefit of having their desired policy applied, that is, their
welfare function with their preferred tax rate. Note that the probability of hav-
ing their preferred policy implemented is synonymous with the probability of
having their preferred politician elected.
The probability of the agricultural communities having their preferred policy
applied is:
Pf = ∑n=ι li
(31)
f ∑n= 1 li + ∑n= j mj
The probability of the green communities having their preferred policy applied
is:
P = ∑n= 1 mj
g ∑n= 1 li + ∑n=j mj
(32)
The expected payoff of each community is the probability of having its
preferred policy applied, minus the probability of it not being applied, minus its
own initial lobbying investment. The problem thus becomes for each community
to maximize its expected return by applying the correct amount of lobbying
effort, i.e.
∑n1 l∙ Z „4
maxE {ΠF}
i=1 li 2
∑n= 1 li + ∑n= j mj ^n aLτ L^
+ (1 - ∑nι TjΣ∑П2 m Hln aH τ - c1xHτ) - li (33)
i=1 li + j=1 mj
18
More intriguing information
1. Sustainability of economic development and governance patterns in water management - an overview on the reorganisation of public utilities in Campania, Italy, under EU Framework Directive in the field of water policy (2000/60/CE)2. Wage mobility, Job mobility and Spatial mobility in the Portuguese economy
3. CGE modelling of the resources boom in Indonesia and Australia using TERM
4. Personal Experience: A Most Vicious and Limited Circle!? On the Role of Entrepreneurial Experience for Firm Survival
5. The name is absent
6. The name is absent
7. Wirkt eine Preisregulierung nur auf den Preis?: Anmerkungen zu den Wirkungen einer Preisregulierung auf das Werbevolumen
8. Synthesis and biological activity of α-galactosyl ceramide KRN7000 and galactosyl (α1→2) galactosyl ceramide
9. The migration of unskilled youth: Is there any wage gain?
10. Les freins culturels à l'adoption des IFRS en Europe : une analyse du cas français