138
Table 4.3.11: Comparison between 5th and 8th graders: a sense of progress (1)
|
5lh graders _____ |
8lh graders__________________________ | ||||||
|
N_______ |
Mean |
SD |
N_______ |
Mean |
SD | ||
|
Practical |
t=14.490, df=3073.156, Sig. <.01 |
1474 |
∏T38I |
1.31 |
2143 |
2.75 |
1.26 |
|
Using a |
t=12.081, df≡2898.757, Sig. <.01 |
1469 |
“злі |
1^37 |
^2138 |
~∑57 |
^T22 |
|
Reading a |
t=6.171, df=3022.550, Sig. <.01 |
1473 |
"У42 |
“T34 |
ТІ41 |
3∕∣5 |
~T26 |
|
Whole-class |
t=19.534, df=2950.471, Sig. <.01 |
1476 |
~3.33I |
^T28 |
2143 |
^∑52 |
ТЇ5 |
|
Group Discussion |
t=14.914, df≡3614, Sig. <.01 |
1474 |
-323 |
T23 |
2142 |
^"∑62 |
"ТЇ9 |
The results of Independent t-tests outlined in Table 4.3.12 and Figure 4.3.9 show that 8th
graders were likely to perceive that Individual work and Individual help promoted sense
of progress more than 5th graders.
Table 4.3.12: Comparison between 5th and 8th graders: a sense of progress (2)
|
5ltl graders____________________________ |
8ltl graders____________________________ | ||||||
|
N |
Mean |
SD |
N |
Mean |
SD | ||
|
Individual Work______ |
t= 7.868, df=2867.825, Sig. < 01 |
1476 |
^146 |
1.34 |
2143 |
3.79 |
1.16 |
|
Individual Help________ |
t= 18.842, df=2760.664, Sig. <.01 |
1475 |
~^320 |
US |
2142 |
^4^03 |
^Tl5 |
Figure 4.3.9: Comparison between 5th and 8th graders: a sense Ofprogress
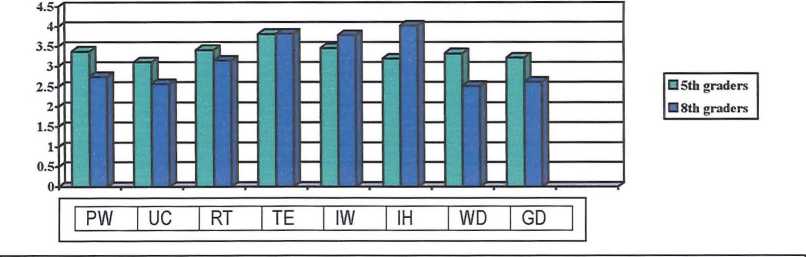
PW = Practical work, UC = Using a ∞mputer, RT= Reading a textbook, TE = Teacher explanation,
IW = Individual work. IH = Individual help. WD = Whole-class discussion. GD = Grouo discussion
Deployment
The results of Independent t-tests detailed in Table 4.3.13 and Figure 4.3.10 show that
5th graders were likely to perceive that Practical work, Using a computer, Reading a
138
More intriguing information
1. The name is absent2. The name is absent
3. Experience, Innovation and Productivity - Empirical Evidence from Italy's Slowdown
4. The name is absent
5. I nnovative Surgical Technique in the Management of Vallecular Cyst
6. THE ANDEAN PRICE BAND SYSTEM: EFFECTS ON PRICES, PROTECTION AND PRODUCER WELFARE
7. A parametric approach to the estimation of cointegration vectors in panel data
8. Fiscal federalism and Fiscal Autonomy: Lessons for the UK from other Industrialised Countries
9. The name is absent
10. The name is absent