USA
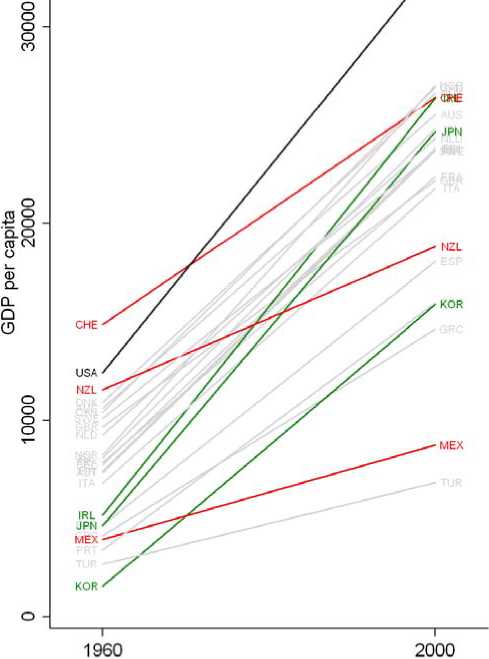
Figure 1. GDP per capita in OECD countries in 1960 and 2000
Notes: GDP per capita in constant international dollars, 24 OECD countries with income and
education data for the whole period. Colom for expositional purposes only.
Source: Authors’ depiction based on data from Heston, Summers, and Aten (2002).
550
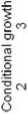
Figure 2. Educational performance and economic growth across OECD countries
Notes: Added-variable plot of a regression of the average annual rate of growth (in percent) of
real GDP per capita in 1960-2000 on the initial level of real GDP per capita in I960, average test
scores on international student achievement tests, and average years of schooling in 1960 (mean
of the unconditional variables added to each axis).
Source: Authors’ depiction based on the regression analysis reported in column (2) of Table 2.
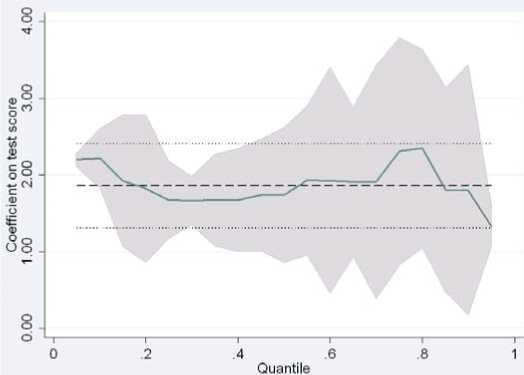
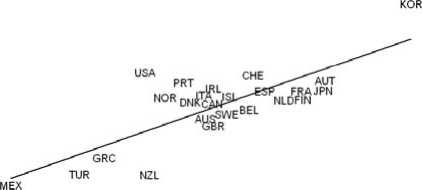
Figure 3. QuantiIe regression estimates
Notes: The straight line represents quantile regression estimates in 5-percent steps of the
coefficient on test scores in a model corresponding to column (2) of Table 2. The shaded area
shows the 90-percent confidence internai of the quantile regression estimates. The horizontal
dashed line represents the OLS estimate and the dotted line its 90-percent confidence interval.
Source: Authors’ depiction based on own regression analysis.
More intriguing information
1. AN IMPROVED 2D OPTICAL FLOW SENSOR FOR MOTION SEGMENTATION2. Demand Potential for Goat Meat in Southern States: Empirical Evidence from a Multi-State Goat Meat Consumer Survey
3. Models of Cognition: Neurological possibility does not indicate neurological plausibility.
4. The name is absent
5. Stillbirth in a Tertiary Care Referral Hospital in North Bengal - A Review of Causes, Risk Factors and Prevention Strategies
6. Menarchial Age of Secondary School Girls in Urban and Rural Areas of Rivers State, Nigeria
7. The name is absent
8. Road pricing and (re)location decisions households
9. CONSIDERATIONS CONCERNING THE ROLE OF ACCOUNTING AS INFORMATIONAL SYSTEM AND ASSISTANCE OF DECISION
10. Program Semantics and Classical Logic