198 H. Mori et al. /International Food and Agribusiness Management Review 3 (2000) 189-205
(A) Age
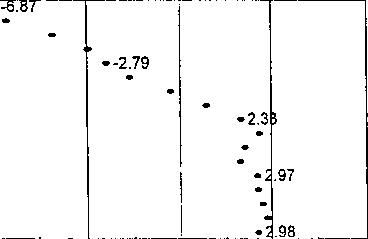
(B) Cohort
1985-89
1975-79 --
1965-69 --
1955-59 --
1945-49 --
1935-39 --
1925-29 --
1915-19 --
< 1909 -L
-3.5
0
3.5
-7
(C) Period
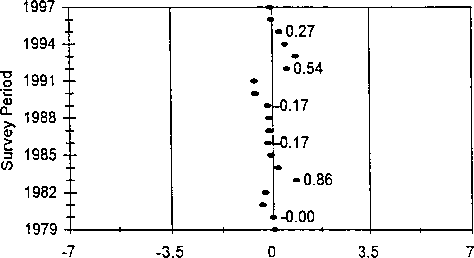
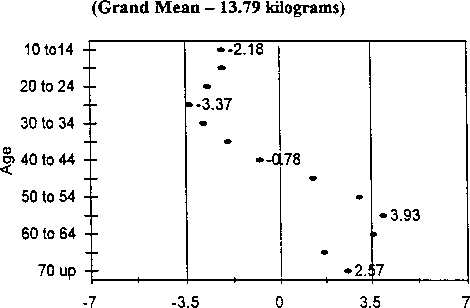
Fig. 3. Estimates of age, cohort and period effects for fresh fish.
4.3. Fresh fish (Fig. 3)
Another traditional Japanese food, fish is one of the primary protein sources for the
Japanese. The consumption grand mean is 13.79 kilograms per year. Fresh fish has age
More intriguing information
1. American trade policy towards Sub Saharan Africa –- a meta analysis of AGOA2. Sector Switching: An Unexplored Dimension of Firm Dynamics in Developing Countries
3. The changing face of Chicago: demographic trends in the 1990s
4. Apprenticeships in the UK: from the industrial-relation via market-led and social inclusion models
5. Legal Minimum Wages and the Wages of Formal and Informal Sector Workers in Costa Rica
6. The name is absent
7. The name is absent
8. The name is absent
9. The magnitude and Cyclical Behavior of Financial Market Frictions
10. The name is absent