Chapter 4
σ0=e([AOH÷]-[AO]-[B])
[4.36]
Here КНСОз is the adsorption equilibrium constant.
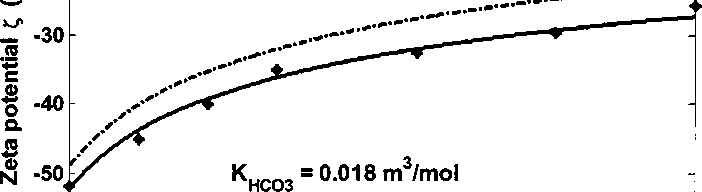
* Experiment data
-----Fitted curve with bicarbonate adsorption
-------Fitted curve without bicarbonate adsorption
-20
E
-60
.701—I--------------∣--------------∣--------------ɪ--------------1--------------1--------------1—
0.02 0.04 0.06 0.08 0.1 0.12 0.14
C(NaHCO3) (M)
Figure 4.24 Kaolinite zeta potential adding NaHCO3 in de-ionized water at pH 8.3
Figure 4.24 shows zeta potential of kaolinite as the function of NaHCO3
concentration at bulk pH 8.3. With the increase concentration of NaHCO3, zeta
potential becomes less negative. This is due to the increase of ionic strength. The
dashed curve shows the fitted results assuming no HCO3^ ion adsorption. The
deviation of experiment data and fitted result indicates the effect of HCO3' ion
adsorption. The solid curve shows the fitted results assuming HCO3' ion
adsorption and the adsorption constant Кнсоз is 0.018 m3∕mol. The fitted curve
132
More intriguing information
1. Cardiac Arrhythmia and Geomagnetic Activity2. Robust Econometrics
3. The Functions of Postpartum Depression
4. The name is absent
5. NATURAL RESOURCE SUPPLY CONSTRAINTS AND REGIONAL ECONOMIC ANALYSIS: A COMPUTABLE GENERAL EQUILIBRIUM APPROACH
6. STIMULATING COOPERATION AMONG FARMERS IN A POST-SOCIALIST ECONOMY: LESSONS FROM A PUBLIC-PRIVATE MARKETING PARTNERSHIP IN POLAND
7. The name is absent
8. The name is absent
9. IMPACTS OF EPA DAIRY WASTE REGULATIONS ON FARM PROFITABILITY
10. The name is absent