1.2
1
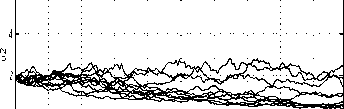
at the constraint. However, this does not affect
the consumption strategy. The new discounted
total utility is 717 and the standard deviation
equals 108, which is substantially less than un-
der the unconstrained regime. The wealth and
strategy sample paths are shown in Figure 18.
The conservative investment strategy results in
much less “volatility” in consumption and wealth
as observed by eye and measured by the utility
standard deviation.
0.4
0.2
0.8
м
= 0.6
2
4
6
8
10
0
wealth χi04
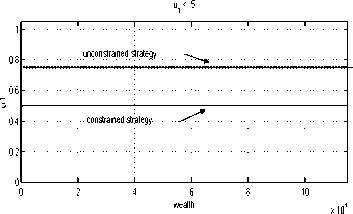
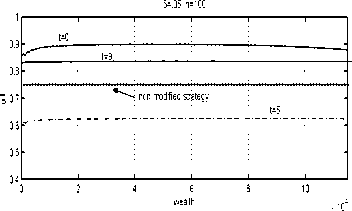
Fig. 15. Cosine modified strategies.
x 104
Cosine modifies realisations
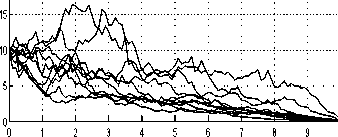
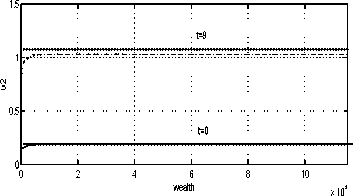
Fig. 17. Constrained strategies.
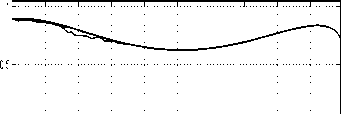
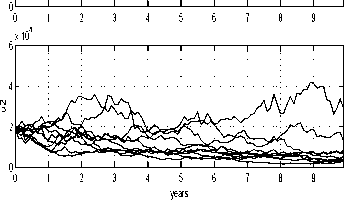
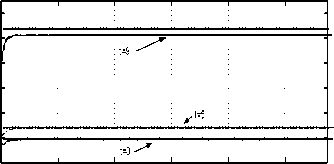
Fig. 16. Cosine modified realisation paths.
5.2 Constrained Policies

1∣-........!.........!.........!.........■.........!.........!.........■.........I
= 0.5---------------:----------------:----------------`----------------`----------------:----------------`----------------`-----------------
A portfolio manager might have an a, priori belief
that their investment should not exceed a certain
wealth percentage. Such a constraint can easily be
allowed for in the above numerical optimisation
procedure.
Suppose that the permissible investment level is
Ui = .5. Figure 17 reveals the modified strategy.
Not surprisingly, the agent is expected to invest
0---------------------1---------------------1---------------------∣---------------------1---------------------1---------------------1---------------------1---------------------1---------------------L
0 1 2 3 4 5 6 7 8 9
x 104
61---------------------1---------------------1---------------------1---------------------1---------------------1---------------------1---------------------1---------------------1---------------------Γ
0∣---------------------1---------------------1---------------------1---------------------1---------------------1---------------------1---------------------1---------------------1---------------------L
0 1 2 3 4 5 6 7 8 9
Fig. 18. Constrained strategy realisation paths.
12
More intriguing information
1. MULTIPLE COMPARISONS WITH THE BEST: BAYESIAN PRECISION MEASURES OF EFFICIENCY RANKINGS2. Dementia Care Mapping and Patient-Centred Care in Australian residential homes: An economic evaluation of the CARE Study, CHERE Working Paper 2008/4
3. The name is absent
4. Fortschritte bei der Exportorientierung von Dienstleistungsunternehmen
5. Voluntary Teaming and Effort
6. The magnitude and Cyclical Behavior of Financial Market Frictions
7. A Classical Probabilistic Computer Model of Consciousness
8. Growth and Technological Leadership in US Industries: A Spatial Econometric Analysis at the State Level, 1963-1997
9. Concerns for Equity and the Optimal Co-Payments for Publicly Provided Health Care
10. The Modified- Classroom ObservationScheduletoMeasureIntenticnaCommunication( M-COSMIC): EvaluationofReliabilityandValidity